18 Sep 2017
The Essentials of Earned Value Management


I’m a true advocate for using (a basic implementation) of EVM on all your projects, or at least the philosophy. The use of Earned Value Management metrics gives a good insight in your current project status at a simple glance. By planning your project carefully and assigning budgets, in hours, euros, documents, resources, to your activities, a world of possibilities opens. Every project stakeholder can have their own personalized reports on their points of interest, with their own style of preference.
Let’s kick it off easily. When you’ve built your cost-loaded schedule in your preferred scheduling tool, like Oracle Primavera P6 or Microsoft Project, and you’ve set a baseline, you can start the Earned Value Analysis. Most of the time, the analysis will be done in the tool itself, the table will represent most parameters we know from our previous blog posts:
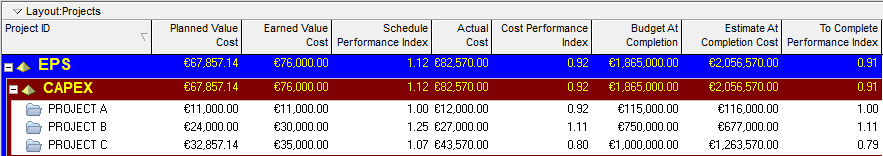
This way of reporting might be enough to evaluate the current project’s health, without retro or prospective functionalities. A tabular representation doesn’t speak to most people. In the next step, we’ll make it more appealing.
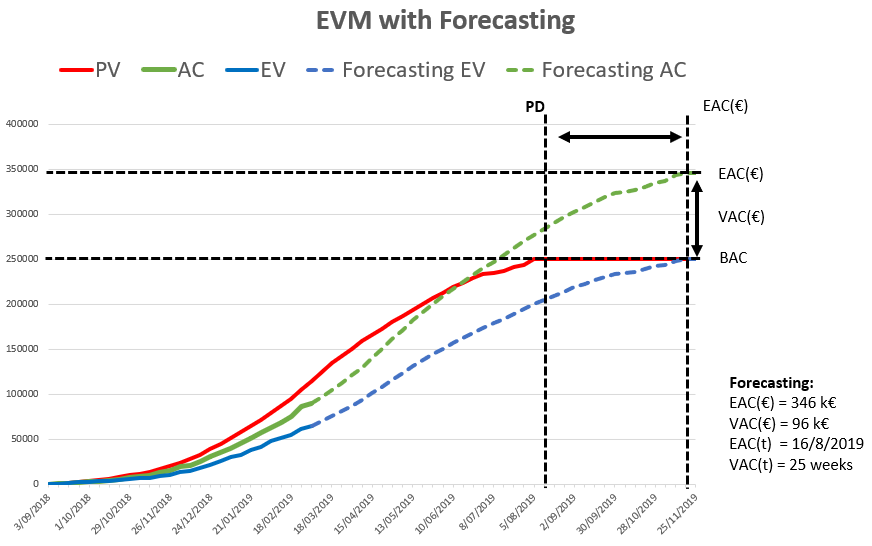
For the more graphically oriented people, EVM provides its classic curves, displaying the time-phased evolution of the metrics. Primavera P6 can generate Earned Value Graphs in the Activity Usage Profile, however the options to change the look and feel are very limited, and the distribution of historical data is not correct when you’re not using the ‘Store Period Performance’ functionality. An example of what it could look like underneath.
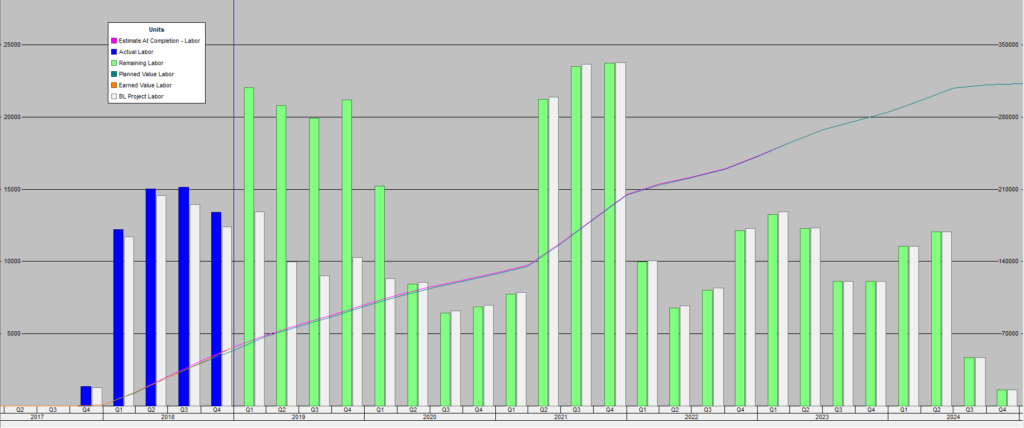
Because of these shortcomings, I would recommend using the time phased data from your planning tool and either keeping it in our most accessible reporting tool, Excel, or to use the ‘Store Period Performance’ functionality and integrate with a Business Intelligence solution.
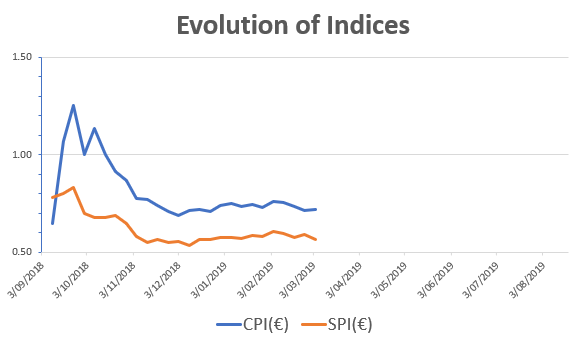
By using Excel for EVM, we can easily create the EVM graphs ourselves, add some conditional formatting to make it more appealing and even monitor the evolution of the indices over time. This can all be done easy and generates good results.
Other options to generate such graphs straight out of your planning tool, would be to use Deltek Cobra, which is specifically designed for EVM purposes. If your enterprise is using Oracle Unifier, there is a very promising add-on for Earned Value Management, which keeps contract data and interfaces this with the activities from Primavera P6 and analyzes the EV-performance.
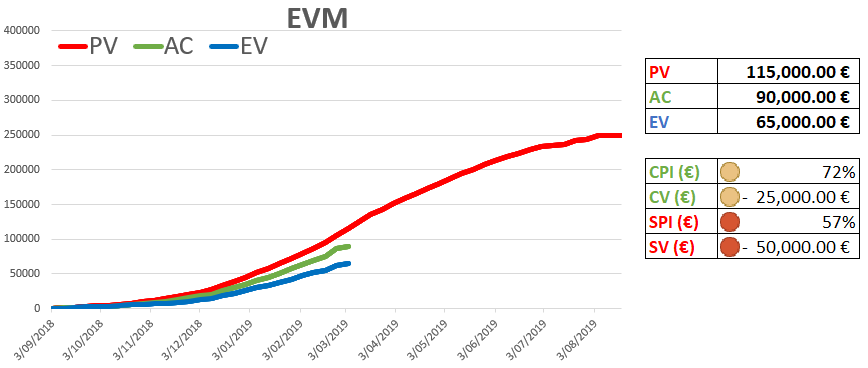
For the following, graphs were generated combining the following blog posts:
As you can see, using only the three EVM metrics and some Excel formulas we can generate a full EVM cost and schedule forecasting graph. These graphical representations can ameliorate story telling in meetings with stakeholders. You can point out a problematic situation without diving into the calculations, which is left to the project controls engineer.
It is recommended that during the creation of the report, some clear agreements are made to which extrapolation methods will be used. This ensures clear understanding of what exactly we are all looking at. We stipulate that the use of the Independent EAC (IEAC (€)) is recommended for these graphical representations. This is especially true for communications to parties that don’t have full understanding of the underlying data.
EVM time forecasting, when done on project level, does not take the schedule logic into account. Some non-critical activities could have bad SPI (t), which is used for the extrapolation, resulting in an unfounded EAC (t) date. A technique to resolve this, is to extrapolate the critical path from the project and use this to perform the EAC(t) analysis, as explained by the Earned Schedule inventor in this article[[1]].
We dream of projects where the generated data enables us to create (EVM) reports that will deliver true project insight. For this we’ll need a well-structured project planning, optionally interfaced with third-party applications. By interfacing other applications like a document management system we can generate EVM(-like) reports based on document status etc. Separate reports for external works/internal works can easily be created.
Another idea would be to identify the types of work and their separate extrapolation methods. Works that have the same type of activities would be extrapolated by the same SPI and CPI for time/cost forecasting.
Taking project controls to the next level is what we at Primaned Belgium dream about. Utilizing all data sources available and integrating them, combining different sorts of data to support our analyses is how we would like to see the industries evolve. Assisting our clients gaining project insight is our goal. Evolving the project controls maturity level of our clients happens step-by-step, and an EVM implementation is a very useful start. I hope you’ve learnt that the learning curve is steep, and evolution is fast when you start using these three simple metrics to support your decision making/storytelling activities.
[[1]] Lipke, Walt. (2018). Applying Earned Schedule to Critical Path Analysis and More.
This blog is part of our Earned Value Series: