

30 Jan 2026
How to prepare for delay analysis through better project controls


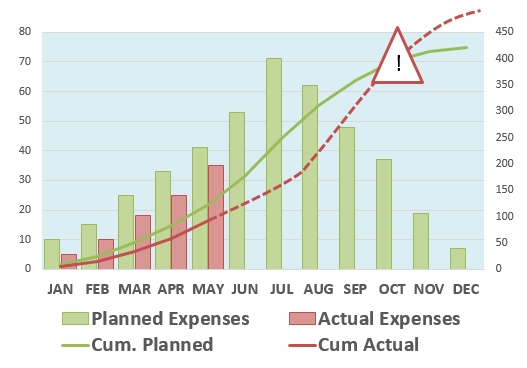
Monthly, quarterly or yearly budgets are a holy grail to most finance departments. This cost controlling system then often applies to your project budgets too, while it shouldn’t. If you do not spend your periodical budget, the finance department will notice an underspending (which we refer to as an accounting variance) and report good performance to the board, while something else might be the cause of your ‘underspending’ (see the graph below, the month of May). Due to delays and dependencies of other factors, the planned scope might have shifted beyond the budget cutoff date and your financial performance might not be as good as they presumed. The issue with traditional finance control for projects is that the effects of schedule delay and cost variance cannot be properly separated. The alarm bell will only ring when your actual spending crosses the planned amount of budget (the month of October in the graph below). In order to prevent this late signalization, a reporting system was born in industrial manufacturing at the start of the 20th century. In the 1960’s the United Stated Department of Defense adopted this system, then still called PERT/COST. This was the start of the now widely-adopted practice called Earned Value Management. In this blog post, I’ll state the basics of the Earned Value Management metrics and interpretation.
Planned Value (PV) or Budgeted Cost of Work Scheduled (BCWS) is the key element of EVM. It is the approved amount of value you address to activities in the schedule. This schedule becomes the baseline at baseline sign-off. When completing these activities, you earn this value at the timepoint you complete the activity.
Taking a look at our sample data, the work has a Total Value (TV), or Budget At Completion (BAC) of € 5.000 and a total planned duration of 10 days. Which estimates the Planned Value at € 500 per day.
Taking the budget calculations into account, we can state the cost per m² flooring at € 50, this is our planned value (PV) or Budgeted Cost of Work Scheduled (BCWS) per square meter. Knowing this, we can state that the value we create by realizing a square meter of flooring equals € 50. This means that every time we realize a square meter of flooring, we earn the value of € 50 for the project.
This value has been named Earned Value (EV) or Budgeted Cost of Work Performed (BCWP). For example, when we have realized 12 m², the Earned Value at this point in time is € 600.
The actual cost of the work is calculated by multiplying the performed man hours by the cost of one man hour added to the cost of bricks used. It’s important to state that the bricks have been used and not just ordered or delivered. We want to reflect the actual cost of the value created by the work. Let’s say the performed work to date looks like this:
| m² | Hours | ||
| Day | *€20/m² | *37,5/hour | AC |
| 1 | 5 | 16 | € 700,00 |
| 2 | 8 | 14 | € 685,00 |
| 3 | 8 | 12 | € 610,00 |
| 21 | 42 | € 1995,00 |
At the end of day 3 of the project, we’ve consumed 21 square meters of bricks, in 42 man hours. This makes the following values for PV, EV and AC. We had planned for €1.500 € to be done before the cut-off date, €1.050 of work has been earned and we already paid €1.995 to do the work. They are typically displayed in a graph like the one underneath. For the ease of this example, the graph shows a linear curve.
| PV | 3 days × € 500 = | € 1.500 |
| EV | 21 m² × € 50 = | € 1.050 |
| AC | € 1.995 |
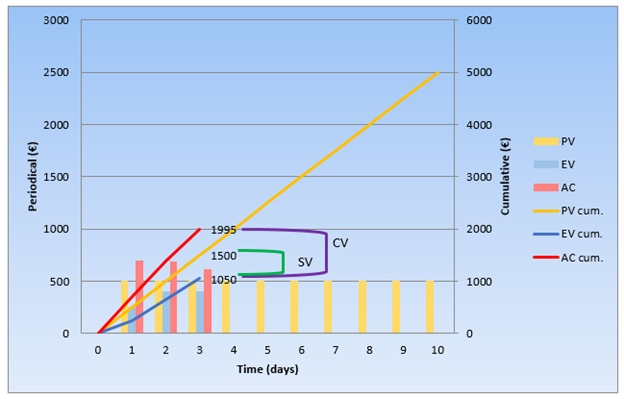
These are the three main parameters for Earned Value Analysis. Starting from here, we can run an analysis of how the project is performing. For this we add two variance characteristics, respectively Schedule Variance (SV) and Cost Variance (CV). These variances display the negative or positive relationship of the performance (EV) to the plan (PV or AC). They split the accounting variance into a schedule and a cost effect. We calculate them as follows:
CV = EV - AC
SV = EV - PV
From our example: CV = € - 945 and SV = € - 450
Graphically these parameters reflect the difference between the cumulative EV and PV (or AC) lines in the graph.
Analysis of these variances teaches us that in this phase of the project, our cost is € 990 higher than we estimated in the baseline. Whilst the Schedule Variance is negative, which means you had planned to have more work done by now. The value which you didn’t earn is € 450, or 9 m² considering the PV per m². Action should be taken on cost and execution efficiency.
Consecutively we add the indices to the variances to display the performance of this project as a KPI. By dividing the Earned Value by the Planned Value or the Actual Cost we respectively gain the Schedule Performance Index (SPI) and the Cost Performance Index (CPI). Small mnemonic; if the SPI or CPI value is GREATER than 1, you’re OVERperforming (ahead of schedule, or under budget). If on the other hand, SPI or CPI is UNDER 1, your project is UNDERperforming (behind of schedule, or over budget).
CPI = EV/AC
SPI = EV/PV
From our example: CPI = 0,526 and SPI = 0,7
Knowing the mnemonic, we’re underperforming on cost and on schedule since the value is under 1,00. But how do we interpret these KPIs and how can we better control our projects using them? We can say that for every euro spent, we earn € 0,526 in value. Which can be caused by underbudgeting our project or overspending. Either way, this deserves further investigation.
As for the SPI, one can say that the project is executing at a 70% efficiency, in comparison to the schedule as planned. Acceleration actions should be taken to make the within the agreed timeframe. Note that the EV at the end of the project will always reach the BAC or TV and thus the SPI will reach the value of 1 in any case.
Thanks to this analysis we now have insight into the real health of a project.
If this principle for progress measurement and reporting is carried out over the entire project, you can greatly benefit from performing Earned Value Analysis. This technique grants a quick insight in your project and will serve as a caution flag for further investigation of any performance issues.
The methods discussed in this example are just the tip of the iceberg. If you are interested in implementing a genuine Earned Value Management System, there is much more to know. More thorough methods like Estimate at Completion extrapolation methods, Earned Schedule calculations and furthermore will all be handled in our blog. I strongly suggest you to keep on reading about this topic to achieve more project insight.
This blog is part of our Earned Value Series:


