

07 avr. 2026
Mastering weather downtime in project schedules with WeatherWise


The header image is a wordcloud taken from 600 user reviews of Microsoft Power BI on www.softwareafvice.com. Microsoft Power BI has grown explosively both in functionality and in popularity. But does that mean it’s also the best?
In one of our previous blogs it was apparent that the term Business Intelligence is on a steady rise since 2015. What I didn’t tell yet is that according to Google Trends there is one very related search term that is probably behind this surge: “Microsoft Power BI”. In its 5 years of existence, this BI tool has grown explosively both in functionality and in popularity. But does that mean it’s also the best?
When I started exploring the different BI-focused tools available in the market, this was quite open. Static and heavy solutions were making room for so called lightweight “self-service” alternatives. In an early comparison by Gartner, you can see Tableau as a leader in this new approach with Qlik as a promising 2nd. Microsoft was already among the top competitors even before Power BI existed, due to the widespread use of Excel for visualizations.
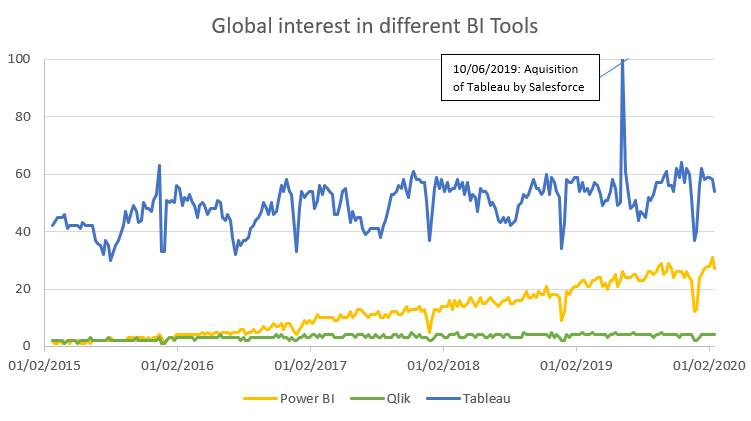
Power BI was released on the market in 2015. It grew out of functionalities that were prior Excel add-ons: Power Query, Power Pivot, Power View and Power Maps. The new tool wasn’t great in all aspects: customization of visuals was rather limited, but it was relatively easy to use, felt familiar for Excel users and had a major selling point: the desktop version is free.
In 2014 Microsoft changed its company culture. They put their focus back on applications and invested heavily in Office and the “power suite” (Power BI, Power Apps, Power Automate). From Office 365, Power BI became part of the Office suite. Such a powerful tool within a package that everybody loves and understands brought BI to the bigger public.
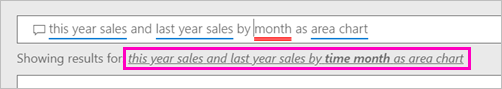
With a monthly update cycle, Power BI is in continuous development. And Microsoft does not limit the updates to patches and fixes, but to real enhancement. They have added over 300 extra features over the last 5 years, with the interface getting more and more in harmony with the other Office products:
And all this investment eventually paid off. Power BI has become one of the most used BI-Tool on the market.
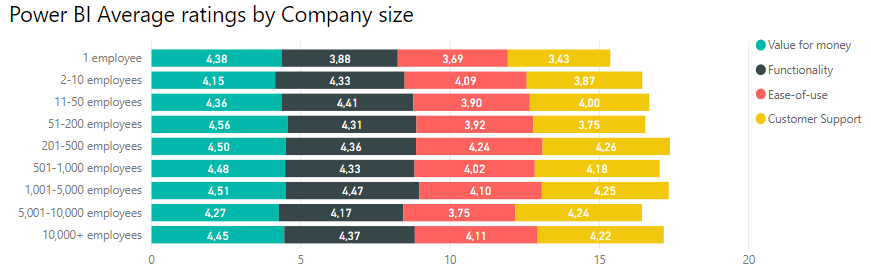
When users review Power BI, it gets the most points for its “Value for money” aspect. This is no doubt the consequence of its “freemium” business model. However, price is only one aspect. How good is power BI, compared to other BI tools in terms of Functionality?
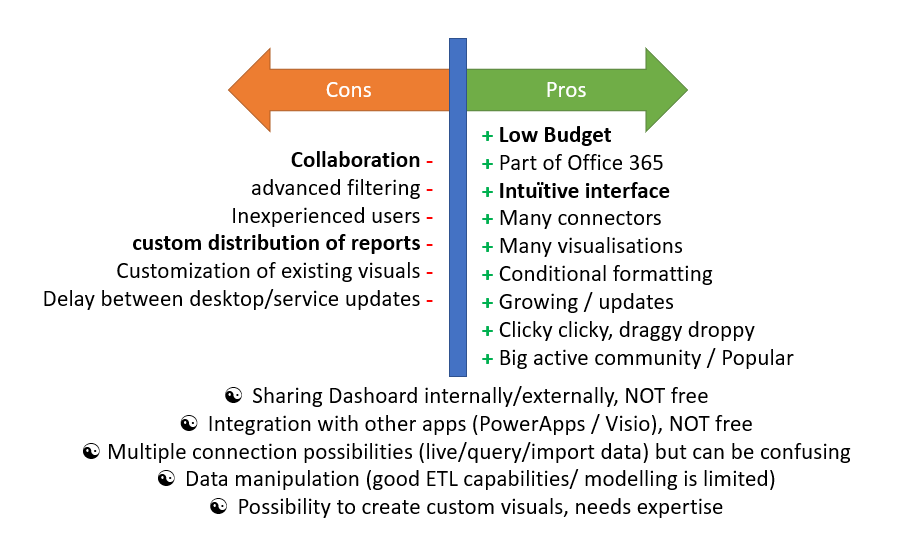
What you should realize though is that Power BI is a dynamic BI Tool. It is perfect for slicing and drilling through your data and performing ad-hoc analyses. But, if you are looking for a tool that is sending out static status-reports to your organization or have visuals with a lot of data-tables, it is less suited.
When comparing to other dynamic BI Tools there will also be some aspects where it might lose. If Tableau has a price tag and requires a higher level of maturity, it performs better with larger volume but. Qlik, on the other hand, is faster for incremental data-models and has a more intuitive use once modelling is done. If you have a lot of data requiring preprocessing, you should look to Alteryx. Finally, Excel still wins in flexibility for basic visuals.
However, as a whole, Power BI didn’t steal its name. It is an easier but yet powerful tool, combining a more familiar interface with the data shaping/cleaning capabilities of Power Query, suitable with almost any data source. And it does not require some knowledge of data modelling to work as intended, as it happens with other tools. Some even dare to claim it’s aimed for naive users. It is not always possible to get exactly the same visual as you would be able to create in Excel, but with some manipulations you can get quite far.
Power BI has definitely earned its leader spot in BI Products. It has known a steady rise in users since it came out and by now 95% of Fortune 500 companies use Power BI.
It’s very easy to start using it, without much training. You can quickly try it out on whatever data-set you have, and it has the possibility to expand to larger ones, with more complex models. There is a very big user community so you can look up for help and knowledge regarding almost any problem you might encounter.
As Proove we are not bound to one software product over another, and our data integration consultants can develop dashboards in many tools. All tools have their advantages and disadvantages but this post makes it clear that Power BI is becoming more and more a viable option. So why not try it out?


