11 Apr 2025
How to find the real critical path via multiple float paths in Primavera


Activity types: ‘Level of Effort’ and ‘WBS Summary’, what are they and what can they be used for? The first ones are also referred to as ‘Hammock activities’. Doesn’t that have a nice ring to it? This term stems from their appearance as activities ‘hanging’ between two dates. In this blogpost, we will give a quick technical explanation and their most common use, but we’ll also show four situations where they can be surprisingly useful.
Both “Level of Effort” and “WBS Summaries” have many similarities to normal activities. Unlike Milestones they can have resource-assignments. The major difference with ‘normal’ activities is that their durations are flexible.
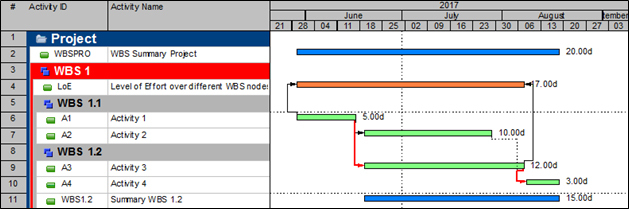
The duration of activities of the type “Level of Effort” (= LoE) are calculated from their predecessor dates (no successors – see Best Practices). They will span over the duration of the earliest linked (FS and SS) date and the latest linked (FF and exceptionally SF – see Best Practices) date.
Activities of the type “WBS Summary” have a duration calculated from the activities within the WBS. There are no links needed and the start/finish will be the earliest start/latest finish of the activities under that WBS node.
Level of Effort activities are most popularly used to allocate overhead resources to your project. They will automatically change their dates based on the progress of the project. The advantage of the Level of Effort over a WBS summary is that you have the flexibility to link it to any activity you want. For example: say some overhead resources only work from the start of the project until the end of the engineering phase and they are not budgeted for the execution and commissioning of the project. In this case, you can’t use a WBS Summary if your Work Breakdown Structure is phase-based (e.g. Project Initiation / Engineering / Execution / Commissioning).
The lowest level of the WBS are the Work Packages. These are amounts of work done by a set of people with a defined scope, budget and time. Often work packages contain deliverables that can be tracked with either activity steps or WBS milestones (see Activity Steps vs WBS Milestones). It’s not possible to make precedency relationships between activity steps. So, if these deliverables are important for the logic of other parts of the schedule, they need to be represented by milestones. After you added this extra level of detail you might still want to track progress on work package level. A Level of Effort or WBS Summary is then ideal to visualize the duration and track the parameters on the desired higher level – scope through steps, budget through resource loading and time through forecasting.
A nifty little trick can be used to visualize buffers and even show how much of it is already consumed.
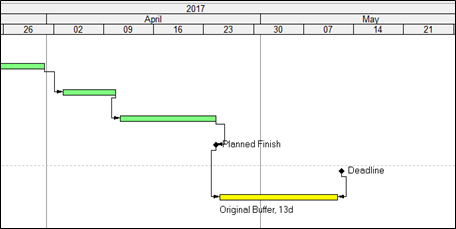
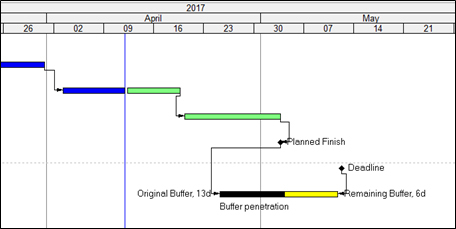
You can reproduce these visualizations with some P6 bars magic. The buffer penetration involves two bars : the black one is the ‘Level of Effort’-bar with baseline dates, the yellow one is with remain dates.
As negative durations don’t exist in P6, a consequence of the duration calculation of Level of Efforts can be used to our benefit. If the earliest link to the LoE’s start is later than the latest link to the LoE’s finish, it’s duration becomes 0. If we exploit this, we can show different bars in different colors for buffers and delays. Following picture illustrates this:
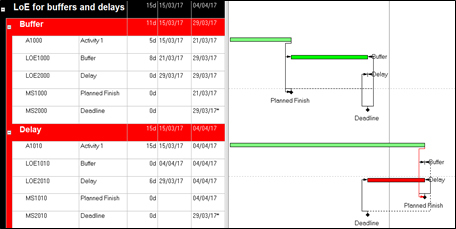
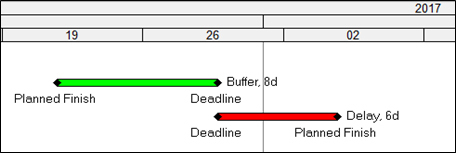
As we crisscross the relationships of the Planned Finish and the Deadline, one of the LoE’s will have a null duration. We now filter on milestones and remaining durations bigger than 0, we select the bars we want to see when collapsed and we add some relevant bar labels. We collapse and voilà, a nice overview of milestones and their buffer/delay is created.
Level of Efforts and WBS summaries can be used for more than you would think. Besides the obvious resource allocation benefits, a lot of other information can be stored in these activities. You can actually use their features to visualize and bring insight to your project – it might even get you that coveted pat on the back from your manager.
Do you have some other tricks with Level of Efforts that you want to show us? Get involved and use the comment section below!