04 Jul 2023
Improve project insights by changing your data analytics approach


I often hear people telling their organization is not mature enough to have some business intelligence dashboards to visualize their projects’ performance. I believe that in some way they are right; having a higher maturity in project controls is always desirable and it’s proven that it brings better results. However, I am not sure it should really prevent them from having business intelligence dashboards. Let’s explore this in this blogpost!
I will not define Business Intelligence or recall what’s project controls in this post since Matthias has done it in his last post about Project Intelligence.
In this post, I would like to focus a little more on “what’s a dashboard?”. I think the dashboard we know the best is the one in a car. But what does it show? Speed, RPM, Oil Temperature, Fuel, average speed, different alerts… It’s showing some indexes, metrics and data helping you to make decisions.
In project controls, there are many KPIs, metrics and data. A project controls dashboard is simply the aggregation of them, in one single view, supporting you in your decision making.
I believe when some people are speaking about business intelligence dashboards, they imagine one which is the best in class, fully dynamic, containing all the data of all projects, showing exactly what you couldn’t see before and solving all your problems at once. This is a very nice dream and I would love to see that. However, I don’t know many organizations that have this. I think that by starting simple with some indicators, measures and information condensed in a limited page space is already a great achievement as such.
This part is a little more technical. Depending on what you desire, the requirements will vary. If you want the best in class as described above, the data needs to be available, standardized, integrated and accessible. Above that, you will need some very handy data modeling and visualization tools.
The data is very often available. At least, it must be somewhere. However, standardizing and integrating this data might ask a lot of work and change in your organization. This is the reason why people are saying their organization is not mature enough.
Now think about what you have, take one project and look at the available data. Gather some Excel files, look into the tools you already have and start thinking about what you could do if all of this would be standardized, integrated and accessible.
Once you’ve done that, get back on Earth, and think of what you could already achieve with what you have today. There might be a surprise! Very often, I see the data that is available and I think “if only we would make nice visuals out of it!”.
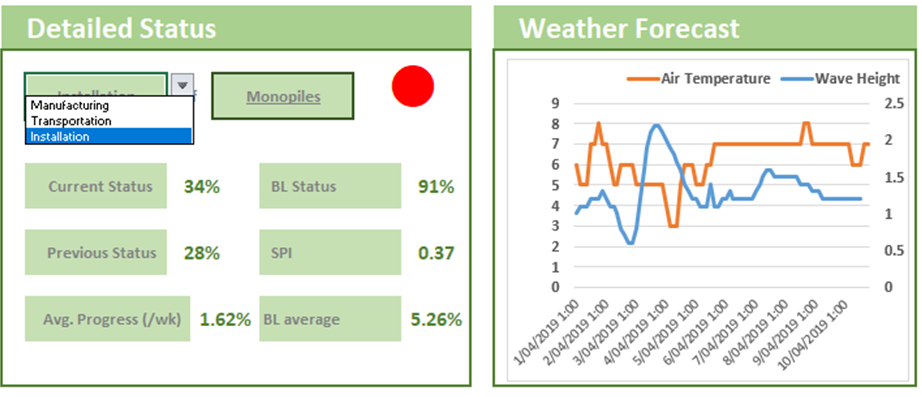
Finally, open Excel, copy paste the different data you could observe and start making what you just dreamed about. It will be a manual process but, in the end, you will improve your base for decision making. I believe lot of people would love to have a supercar when they actually need a mobility solution!
What do you think? Have you done that before? Do you want to share some of the realization you did? Don’t hesitate to comment this post with your realization or remarks!